Insurance Agent Salary in California: $77,720 (2026)
Quick Answer:Across California's 157 metropolitan areas, the average median insurance agent pay sits at $77,720/year heading into 2026 — a figure projected from 2025 BLS OEWS wage data for SOC 41-3021. Because California sits at BEA RPP 113.1 (13% above the U.S. baseline), that statewide median translates to roughly $68,718 in nationally-comparable purchasing power. Highest-paying metros: Oakland ($97,817), Fremont ($95,659), San Francisco ($95,640).
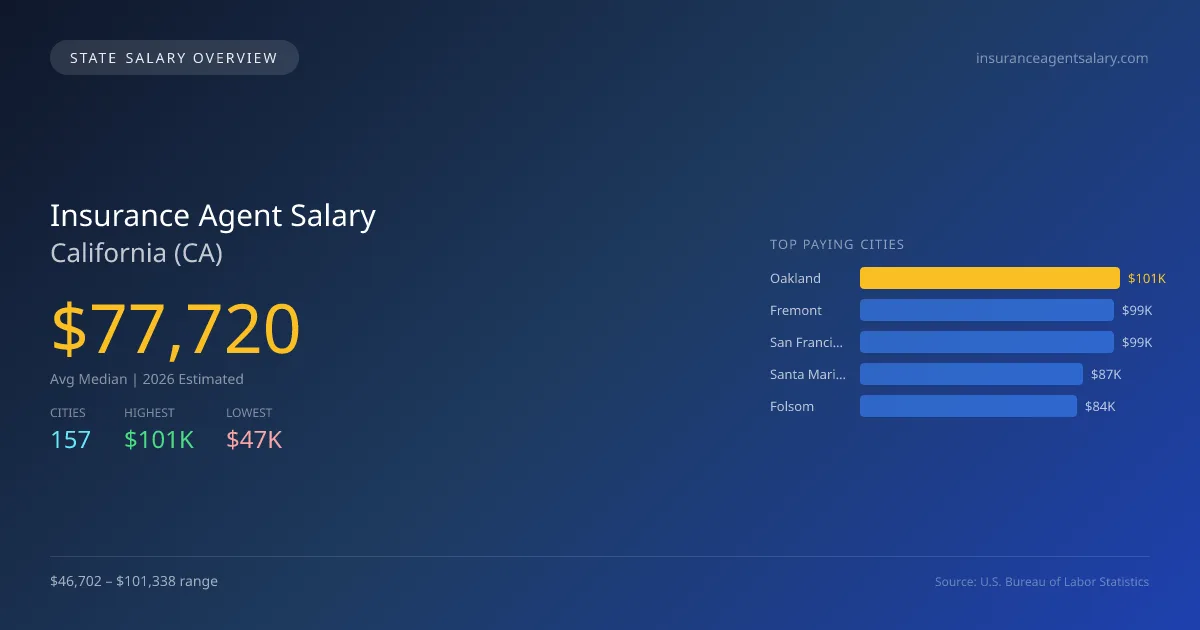
In 2026, the average median salary for insurance agents in California is projected to be $77,721, surpassing the national median of $64,522 by 20.5%. This salary variation reflects strong local demand and cost of living factors. The highest paying city is Oakland, with an average salary of $101,338, while Lodi is the lowest at $46,702, highlighting a significant gap of $54,636 that can be attributed to different market conditions, clientele diversity, and economic factors in these areas. California’s state licensing requirements for insurance agents can be stringent, necessitating thorough training and compliance with various regulations. The demand for agents is sustained by a growing population and an increasing need for diverse insurance products, particularly in metropolitan areas. The projected annual growth rate for insurance agent employment in the state is 3.60%, indicating a steady expansion in job opportunities. With 39,279 insurance agents employed across 157 metro areas, cities like Fremont ($99,103), San Francisco ($99,083), Santa Maria ($87,014), and Folsom ($84,421) also offer competitive salaries. Individuals looking to enter this field should be prepared to navigate both the regulatory landscape and the varying economic climates of California's cities.
California Insurance Agent Salary Range
Overall salary range in California: $28,952 (lowest entry-level) to $212,204 (highest top earner)
California vs National Average
California insurance agents earn 20.46% more than the national median (+$13,198/year difference).
California Insurance Agent Salary Distribution (2026)
Insurance Agent salaries in California range from $42,041 (entry-level, 10th percentile) to $163,118 (top earners, 90th percentile), with a median of $77,720. The California median is $13,198 above the US national median of $64,522. The average hourly rate is $37.37/hr. Approximately 39,279 insurance agents are employed across 157 cities.
2019 BLS Actual
$55,089
2025 BLS Actual
$75,020
2026 Current Est.
$77,720
2019–2027 Growth
+46.2%
Salary Trajectory for Insurance Agents in California (2019–2027)
2019–2025: actual BLS OEWS data for this metro area. 2026+: CAGR 3.60% projection.
| Year | Annual Salary | Status |
|---|---|---|
| 2019 | $55,089 | Actual |
| 2020 | $52,970 | Actual |
| 2021 | $63,097 | Actual |
| 2022 | $66,228 | Actual |
| 2023 | $63,994 | Actual |
| 2024 | $67,859 | Actual |
| 2025 | $75,020 | Actual |
| 2026(current) | $77,720 | Estimated |
| 2027 | $80,518 | Projected |
Based on 7 years of BLS OEWS data for the California metropolitan area, the median insurance agent salary grew 36.2% from $55,089 (2019) to $75,020 (2025). At a 3.60% compound annual growth rate, salaries are projected to reach $80,518 by 2027 — a total increase of $25,429 (46.16%) from 2019.
Note: Historical values (2019–2025) are actual BLS OEWS figures for the California metropolitan area, sourced from annual Occupational Employment and Wage Statistics surveys. 2026–2026 figures are current estimates, and 2027 values are projections, calculated using a 3.60% CAGR derived from 7-year BLS historical data. Actual salaries may vary based on employer, experience, certifications, and local market conditions.
Top 5 Highest Paying Cities in California
Lowest Paying Cities in California
| City | Median Salary |
|---|---|
| Lodi | $46,702 |
| Stockton | $47,356 |
| Bakersfield | $47,397 |
| Chico | $49,904 |
| Yuba City | $51,044 |
Best Value Cities for Insurance Agents in California
When adjusted for local cost of living, these California cities offer the most purchasing power for insurance agents.
| City | Nominal Salary | CoL Index | Adjusted Salary |
|---|---|---|---|
| Oakland | $101,338 | 113.1 | $89,600 |
| Fremont | $99,103 | 113.1 | $87,624 |
| San Francisco | $99,083 | 115.613 | $85,702 |
| Santa Maria | $87,014 | 108.798 | $79,978 |
| Sacramento | $83,854 | 106.67 | $78,611 |
Adjusted salary = nominal salary × (100 / CoL index). CoL index: 100 = national average. Lower index = lower cost of living.
Salary by Experience Level in California
| Experience Level | Estimated Annual |
|---|---|
| Entry Level (0-2 years) | $42,041 |
| Mid Career (3-7 years) | $77,720 |
| Experienced (7+ years) | $163,118 |
Estimates based on BLS percentile data averaged across California metro areas. Individual pay varies by employer, certifications, and specialization.
All 157 Cities in California
| # | City | Median Salary |
|---|---|---|
| 1 | Oakland | $101,338 |
| 2 | Fremont | $99,103 |
| 3 | San Francisco | $99,083 |
| 4 | Santa Maria | $87,014 |
| 5 | Folsom | $84,421 |
| 6 | Sacramento | $83,854 |
| 7 | Roseville | $83,509 |
| 8 | Santa Rosa | $82,548 |
| 9 | Petaluma | $81,759 |
| 10 | Anaheim | $81,055 |
| 11 | Oxnard | $80,580 |
| 12 | Thousand Oaks | $80,255 |
| 13 | Long Beach | $79,902 |
| 14 | Chula Vista | $79,885 |
| 15 | San Diego | $79,793 |
| 16 | Los Angeles | $79,637 |
| 17 | Carlsbad | $79,126 |
| 18 | Vallejo | $78,301 |
| 19 | Modesto | $75,908 |
| 20 | Merced | $72,748 |
| 21 | Salinas | $72,748 |
| 22 | Santa Ana | $71,931 |
| 23 | Fontana | $70,600 |
| 24 | Irvine | $70,523 |
| 25 | Pomona | $70,178 |
| 26 | Simi Valley | $70,139 |
| 27 | Escondido | $70,123 |
| 28 | Fairfield | $69,997 |
| 29 | Fullerton | $69,739 |
| 30 | Daly City | $69,679 |
| 31 | El Monte | $69,656 |
| 32 | Vista | $69,618 |
| 33 | Concord | $69,602 |
| 34 | Hanford | $69,526 |
| 35 | Clovis | $69,498 |
| 36 | Garden Grove | $69,427 |
| 37 | Temecula | $69,410 |
| 38 | Santa Clarita | $69,363 |
| 39 | Lancaster | $69,273 |
| 40 | Inglewood | $69,273 |
| 41 | Corona | $69,185 |
| 42 | Richmond | $69,174 |
| 43 | Rialto | $69,142 |
| 44 | Torrance | $69,054 |
| 45 | Elk Grove | $68,922 |
| 46 | Oceanside | $68,905 |
| 47 | Whittier | $68,885 |
| 48 | San Rafael | $68,879 |
| 49 | Rancho Cucamonga | $68,817 |
| 50 | Hayward | $68,779 |
| 51 | Woodland | $68,761 |
| 52 | Buena Park | $68,751 |
| 53 | Encinitas | $68,745 |
| 54 | Downey | $68,741 |
| 55 | Dublin | $68,702 |
| 56 | Redlands | $68,681 |
| 57 | Chino | $68,643 |
| 58 | Westminster | $68,622 |
| 59 | Santa Monica | $68,616 |
| 60 | San Mateo | $68,609 |
| 61 | Tulare | $68,589 |
| 62 | San Buenaventura | $68,566 |
| 63 | Moreno Valley | $68,519 |
| 64 | Mission Viejo | $68,519 |
| 65 | Pleasanton | $68,509 |
| 66 | Pasadena | $68,411 |
| 67 | Santee | $68,364 |
| 68 | Glendale | $68,302 |
| 69 | Mountain View | $68,267 |
| 70 | Pittsburg | $68,261 |
| 71 | Novato | $68,240 |
| 72 | Costa Mesa | $68,214 |
| 73 | Berkeley | $68,143 |
| 74 | Huntington Beach | $68,126 |
| 75 | Jurupa Valley | $68,066 |
| 76 | Hemet | $68,047 |
| 77 | Union City | $68,041 |
| 78 | West Covina | $68,033 |
| 79 | Chino Hills | $68,014 |
| 80 | Gilroy | $67,917 |
| 81 | San Marcos | $67,880 |
| 82 | Tustin | $67,821 |
| 83 | San Ramon | $67,816 |
| 84 | Sunnyvale | $67,808 |
| 85 | Eastvale | $67,750 |
| 86 | Murrieta | $67,748 |
| 87 | Vacaville | $67,748 |
| 88 | Brentwood | $67,718 |
| 89 | Hesperia | $67,686 |
| 90 | Lake Elsinore | $67,681 |
| 91 | Citrus Heights | $67,595 |
| 92 | El Cajon | $67,534 |
| 93 | San Clemente | $67,514 |
| 94 | Bellflower | $67,487 |
| 95 | Palmdale | $67,457 |
| 96 | La Mirada | $67,457 |
| 97 | Apple Valley | $67,444 |
| 98 | Menifee | $67,424 |
| 99 | Yucaipa | $67,396 |
| 100 | Norwalk | $67,392 |
| 101 | Santa Clara | $67,363 |
| 102 | Rancho Cordova | $67,331 |
| 103 | Montebello | $67,266 |
| 104 | Compton | $67,240 |
| 105 | Porterville | $67,192 |
| 106 | Lompoc | $67,183 |
| 107 | Hawthorne | $67,079 |
| 108 | Antioch | $67,057 |
| 109 | Burbank | $67,051 |
| 110 | Alhambra | $66,896 |
| 111 | Livermore | $66,896 |
| 112 | Orange | $66,876 |
| 113 | South Gate | $66,874 |
| 114 | Victorville | $66,859 |
| 115 | West Sacramento | $66,837 |
| 116 | Poway | $66,819 |
| 117 | San Leandro | $66,729 |
| 118 | Indio | $66,654 |
| 119 | Lake Forest | $66,654 |
| 120 | Carson | $66,535 |
| 121 | Rocklin | $66,525 |
| 122 | Newport Beach | $66,412 |
| 123 | Redwood City | $66,407 |
| 124 | Turlock | $66,390 |
| 125 | Manteca | $66,368 |
| 126 | Perris | $66,363 |
| 127 | Madera | $66,309 |
| 128 | San Jose | $66,252 |
| 129 | Baldwin Park | $66,191 |
| 130 | Palo Alto | $66,191 |
| 131 | Lakewood | $66,164 |
| 132 | Beaumont | $65,970 |
| 133 | Tracy | $65,955 |
| 134 | Alameda | $65,933 |
| 135 | Laguna Niguel | $65,918 |
| 136 | Milpitas | $65,884 |
| 137 | Camarillo | $65,745 |
| 138 | Oakley | $65,718 |
| 139 | Davis | $65,702 |
| 140 | Upland | $65,653 |
| 141 | Santa Cruz | $65,579 |
| 142 | La Habra | $65,557 |
| 143 | Lynwood | $65,530 |
| 144 | Brea | $64,411 |
| 145 | Fresno | $63,932 |
| 146 | San Luis Obispo | $62,678 |
| 147 | Visalia | $62,315 |
| 148 | Napa | $60,461 |
| 149 | Ontario | $58,819 |
| 150 | San Bernardino | $58,108 |
| 151 | Riverside | $58,037 |
| 152 | Redding | $51,686 |
| 153 | Yuba City | $51,044 |
| 154 | Chico | $49,904 |
| 155 | Bakersfield | $47,397 |
| 156 | Stockton | $47,356 |
| 157 | Lodi | $46,702 |
More California Salary Data
Hourly Rates
Explore insurance agent hourly pay in California cities.
Senior / Experienced
Top earner salaries for experienced insurance agents.
Compare Cities in California
View all comparisons →Explore More Insurance Agent Salary Data
Frequently Asked Questions
How much do insurance agents make in California in 2026?
What is the highest paying city for insurance agents in California?
How does California insurance agent pay compare to the national average?
What is the entry-level insurance agent salary in California?
How many insurance agents are employed in California?
Which California city offers the best value for insurance agents?
Written by Jordan Lee, MBA
Career Analyst
Jordan has over 10 years of experience in the insurance industry. He specializes in property and casualty insurance. He has worked in both agency and corporate settings.
Methodology & Data Source
Statewide salary figures on this page are 2026 projections based on the Bureau of Labor Statistics Occupational Employment and Wage Statistics (OEWS) survey, May 2026 release. A 3.60% compound annual growth rate (CAGR), derived from 6-year national BLS wage trends, was applied to each metro area's reported salary to estimate current 2026 insurance agent compensation across California. State averages are employment-weighted across 157 metro areas — larger metro areas with more insurance agentscontribute proportionally more to the average, producing figures that better reflect typical compensation. Individual pay varies by city, employer, certifications, and experience.
Data Sources & Methodology
Source: BLS, OEWS, 7-year dataset (–). Per-city data from annual BLS metropolitan area surveys.
2026 figures are projected from 2025 BLS data using a compound annual growth rate (CAGR) of 3.60%, derived from historical BLS wage trends for insurance agents (SOC 41-3021).
Compiled and verified by Jordan Lee, MBA, a licensed insurance agent with 10+ years of clinical experience. · View source data at BLS.gov