Insurance Agent Salary in Oxnard, CA: $80,580 (2026)
Quick Answer:A full-time insurance agent in Oxnard, CA earns a median $80,580/year (≈ $38.74/hour) in nominal terms for 2026 — projected from BLS OEWS 2025 (SOC 41-3021). Once you factor in Oxnard's price level (11% above national, BEA RPP 110.5), that paycheck buys what $72,901 would nationally. Nominal pay sits 18.7% above the California state average.
Official BLS data · View source
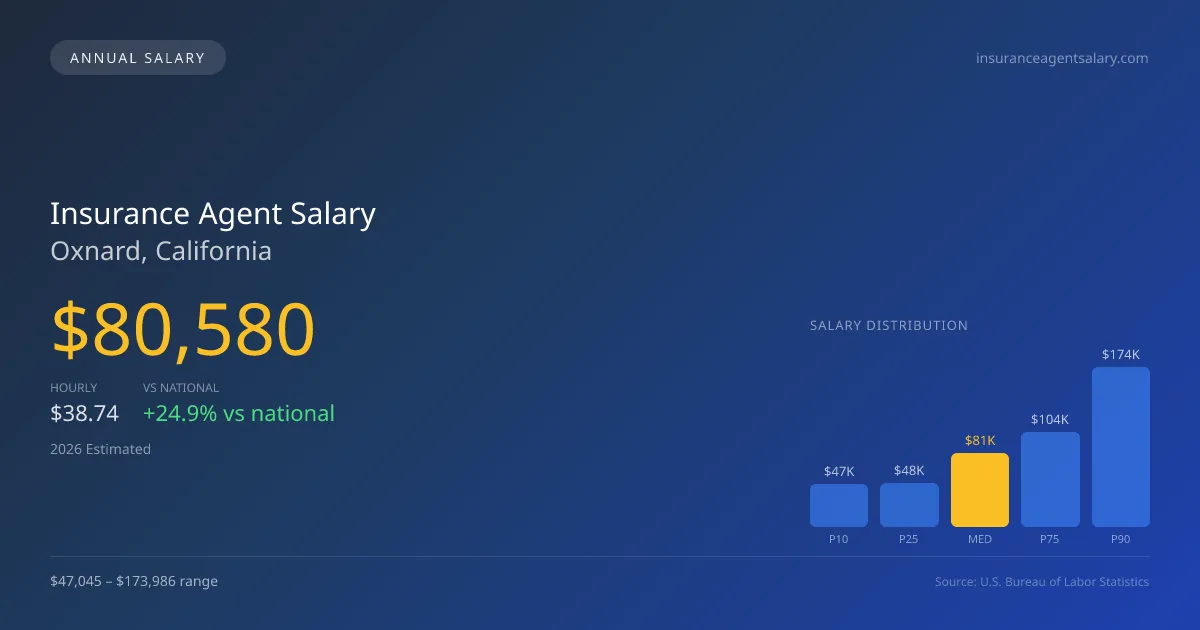
In Oxnard, California, the projected median salary for an insurance agent in 2026 is set at $80,580, surpassing the national median by approximately 24.89%. The compensation range here is notable, with entry-level positions at around $47,045 and top earners reaching up to $173,986. This data, derived from 2025 BLS OEWS surveys and projected to 2026, highlights the city’s competitive job market for insurance agents. A mix of career models affects pay, ranging from captive agents at leading firms like State Farm and Allstate to independent agents and larger commercial brokerages. As the insurance landscape continues to evolve, understanding these structural divides is essential for those evaluating their earning potential in Oxnard.
Salary Breakdown
| Percentile | Annual | Hourly |
|---|---|---|
| Entry Level (P10) | $47,045 | $22.62 |
| Lower Range (P25) | $48,371 | $23.26 |
| Median (P50)(typical) | $80,580 | $38.74 |
| Upper Range (P75) | $103,652 | $49.83 |
| Top Earners (P90) | $173,986 | $83.65 |
Median Salary Position
24.89% above the national average
2026 Salary Percentile Distribution in Oxnard
In Oxnard, CA, the insurance agent salary spread from the 10th to 90th percentile is $126,941 (2026 est.). At $80,580, the local median is 24.89% above the national median of $64,522.
Salary Calculator
At 40 hours/week in Oxnard: You'd be in the lower-middle range
How Oxnard Insurance Agent Pay Compares
Oxnard median: $80,580/year (2026)
| Compared To | Median Salary | Oxnard Pays |
|---|---|---|
| California Average | $67,885 | +18.70% more |
| National Average | $64,522 | +24.89% more |
Insurance Agents in Oxnard, CA earn a median of $80,580 per year (2026 est.), which is 24.89% higher than the national median of $64,522 and 18.70% above the California state average of $67,885.
Cost-of-Living Adjusted Salary
Oxnard has a cost of living 10.53% above the national average.
Adjusted salary = nominal × (100 / CoL index). CoL index: 100 = national average.
Oxnard, CA has a cost-of-living index of 110.534 (above the national average of 100). While the nominal salary of $80,580 is competitive, the higher cost of living reduces purchasing power to an effective $72,901 — a 9.53% reduction.
Compare Purchasing Power
Select a city to see how your salary compares after cost of living
Select a city above to compare purchasing power
2019 BLS Actual
$60,190
2025 BLS Actual
$77,780
2026 Current Est.
$80,580
2019–2027 Growth
+38.7%
Salary Trajectory for Insurance Agents in Oxnard (2019–2027)
2019–2025: actual BLS OEWS data for this metro area. 2026+: CAGR 3.60% projection.
| Year | Annual Salary | Status |
|---|---|---|
| 2019 | $60,190 | Actual |
| 2020 | $60,670 | Actual |
| 2021 | $58,880 | Actual |
| 2022 | $61,910 | Actual |
| 2023 | $58,870 | Actual |
| 2024 | $48,440 | Actual |
| 2025 | $77,780 | Actual |
| 2026(current) | $80,580 | Estimated |
| 2027 | $83,481 | Projected |
Based on 7 years of BLS OEWS data for the Oxnard metropolitan area, the median insurance agent salary grew 29.2% from $60,190 (2019) to $77,780 (2025). At a 3.60% compound annual growth rate, salaries are projected to reach $83,481 by 2027 — a total increase of $23,291 (38.70%) from 2019.
Note: Historical values (2019–2025) are actual BLS OEWS figures for the Oxnard metropolitan area, sourced from annual Occupational Employment and Wage Statistics surveys. 2026–2026 figures are current estimates, and 2027 values are projections, calculated using a 3.60% CAGR derived from 7-year BLS historical data. Actual salaries may vary based on employer, experience, certifications, and local market conditions.
Salary by Experience Level
| Experience | Estimated Salary Range |
|---|---|
| 0-2 years (New Graduate) | $47,045 – $48,371 |
| 3-5 years (Mid Career) | $48,371 – $80,580 |
| 5+ years (Experienced) | $80,580 – $103,652 |
| 10+ years (Top Earner) | $103,652 – $173,986 |
Agent salary ranges estimated from BLS percentile data. Individual insurance agent compensation varies by employer, certifications, and specialization.
Insurance Agent Job Market in Oxnard
With 840 insurance agents currently employed in Oxnard, the local job market exhibits a robust demand for skilled professionals. However, the cost of living index sits at a noteworthy 110.534, reflecting higher-than-average living expenses and impacting take-home pay. Captive agents typically find solid earning potential with structured commission systems but may face limits on upside earnings compared to independent agents or those in larger brokerage firms like Marsh or Aon. The disparity in earnings often hinges on several factors, including the size of one's book of business, specialization in commercial lines versus personal lines, and whether agents own their agency or work as employees. To maximize earning potential, agents may consider focusing on commercial insurance sectors, building their client base, and pursuing additional credentials like the CPCU, all of which can lead to improved compensation and advancement opportunities in Oxnard's evolving market.
More salary data for Oxnard, CA:
Frequently Asked Questions
How much do insurance agents make in Oxnard, CA in 2026?
Is Oxnard, CA a good place to work as a insurance agent?
Can insurance agents make $100K in Oxnard?
What is the cost-of-living adjusted insurance agent salary in Oxnard?
How much does a insurance agent make per hour in Oxnard?
Related Pages
Compare Salaries
Career Resources
Nearby Cities in California
Written by Jordan Lee, MBA
Career Analyst
Jordan has over 10 years of experience in the insurance industry. He specializes in property and casualty insurance. He has worked in both agency and corporate settings.
Methodology & Data Source
Salary figures on this page are 2026 projections based on the Bureau of Labor Statistics Occupational Employment and Wage Statistics (OEWS) survey, May 2026 release. The BLS reported a median annual salary of $77,780 for insurance agentsin the Oxnard metropolitan area. A 3.60% compound annual growth rate (CAGR), calculated from 6-year national BLS wage trends, was applied to project current 2026 compensation. Percentile ranges (P10–P90) represent the full salary distribution across experience levels and practice settings in this market.
Data Sources & Methodology
Source: BLS, OEWS, 7-year dataset (–). Per-city data from annual BLS metropolitan area surveys.
2026 figures are projected from 2025 BLS data using a compound annual growth rate (CAGR) of 3.60%, derived from historical BLS wage trends for insurance agents (SOC 41-3021).
Compiled and verified by Jordan Lee, MBA, a licensed insurance agent with 10+ years of clinical experience. · View source data at BLS.gov