Insurance Agent Salary in Warner Robins, GA: $53,882 (2026)
Quick Answer:A full-time insurance agent in Warner Robins, GA earns a median $53,882/year (≈ $25.91/hour) in nominal terms for 2026 — projected from BLS OEWS 2025 (SOC 41-3021). Once you factor in Warner Robins's price level (6% below national, BEA RPP 93.8), that paycheck buys what $57,450 would nationally. Nominal pay sits 3.2% below the Georgia state average.
Official BLS data · View source
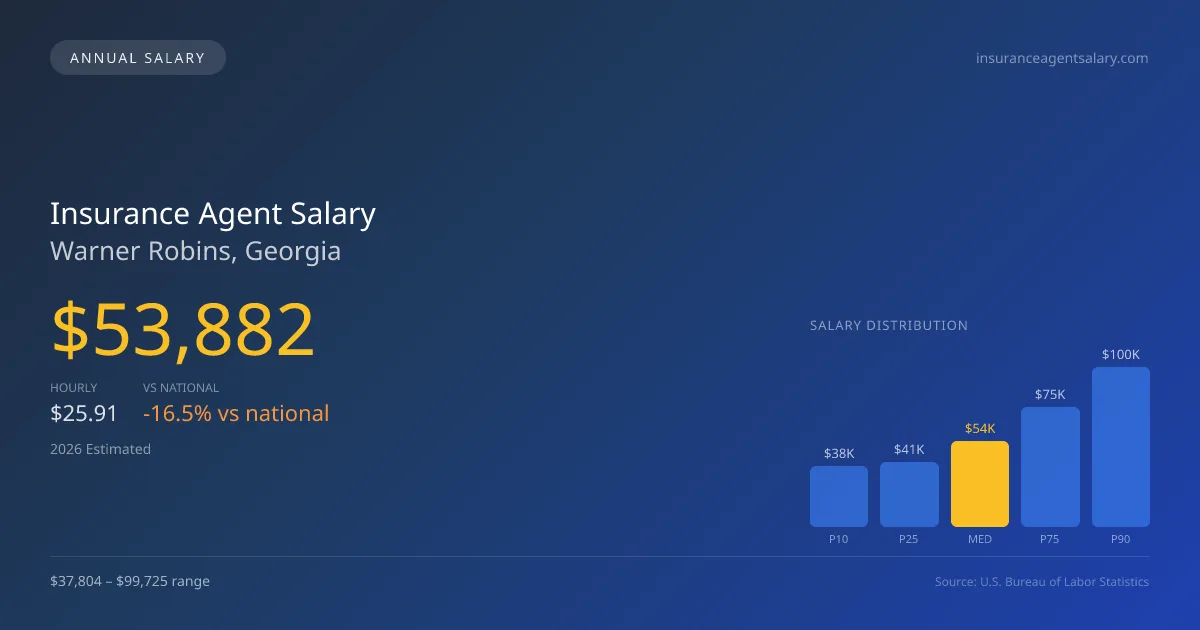
In Warner Robins, Georgia, the insurance agent salary is projected to be quite competitive with a median income of $53,882 in 2026. This figure reflects a diverse salary range that spans from $37,804 at the lower end (P10) to a maximum of $99,725 (P90). Such earnings can vary notably between agents who specialize in personal lines versus those focused on commercial or specialty lines, with the latter typically yielding higher commissions. This data is derived from the official Bureau of Labor Statistics (BLS) Occupational Employment and Wage Statistics (OEWS) surveys, highlighting the evolving landscape of insurance compensation in this region. As Warner Robins continues to adapt to the changing market, opportunities for growth abound in this sector.
Salary Breakdown
| Percentile | Annual | Hourly |
|---|---|---|
| Entry Level (P10) | $37,804 | $18.17 |
| Lower Range (P25) | $40,508 | $19.48 |
| Median (P50)(typical) | $53,882 | $25.91 |
| Upper Range (P75) | $74,830 | $35.98 |
| Top Earners (P90) | $99,725 | $47.95 |
Median Salary Position
16.49% below the national average
2026 Salary Percentile Distribution in Warner Robins
In Warner Robins, GA, the insurance agent salary spread from the 10th to 90th percentile is $61,921 (2026 est.). At $53,882, the local median is 16.49% below the national median of $64,522.
Salary Calculator
At 40 hours/week in Warner Robins: You'd be in the lower-middle range
How Warner Robins Insurance Agent Pay Compares
Warner Robins median: $53,882/year (2026)
| Compared To | Median Salary | Warner Robins Pays |
|---|---|---|
| Georgia Average | $55,664 | -3.20% less |
| National Average | $64,522 | -16.49% less |
Insurance Agents in Warner Robins, GA earn a median of $53,882 per year (2026 est.), which is 16.49% lower than the national median of $64,522 and 3.20% below the Georgia state average of $55,664.
Cost-of-Living Adjusted Salary
Warner Robins has a cost of living 6.21% below the national average, meaning your salary goes further here.
Adjusted salary = nominal × (100 / CoL index). CoL index: 100 = national average.
Warner Robins, GA has a cost-of-living index of 93.789 (below the national average of 100). A insurance agent earning $53,882 nominally has purchasing power equivalent to $57,450 in an average-cost city — an effective 6.62% boost.
Compare Purchasing Power
Select a city to see how your salary compares after cost of living
Select a city above to compare purchasing power
2019 BLS Actual
$42,540
2025 BLS Actual
$52,010
2026 Current Est.
$53,882
2019–2027 Growth
+31.2%
Salary Trajectory for Insurance Agents in Warner Robins (2019–2027)
2019–2025: actual BLS OEWS data for this metro area. 2026+: CAGR 3.60% projection.
| Year | Annual Salary | Status |
|---|---|---|
| 2019 | $42,540 | Actual |
| 2020 | $43,575 | Actual |
| 2021 | $44,340 | Actual |
| 2022 | $34,010 | Actual |
| 2023 | $38,890 | Actual |
| 2024 | $50,400 | Actual |
| 2025 | $52,010 | Actual |
| 2026(current) | $53,882 | Estimated |
| 2027 | $55,822 | Projected |
Based on 7 years of BLS OEWS data for the Warner Robins metropolitan area, the median insurance agent salary grew 22.3% from $42,540 (2019) to $52,010 (2025). At a 3.60% compound annual growth rate, salaries are projected to reach $55,822 by 2027 — a total increase of $13,282 (31.22%) from 2019.
Note: Historical values (2019–2025) are actual BLS OEWS figures for the Warner Robins metropolitan area, sourced from annual Occupational Employment and Wage Statistics surveys. 2026–2026 figures are current estimates, and 2027 values are projections, calculated using a 3.60% CAGR derived from 7-year BLS historical data. Actual salaries may vary based on employer, experience, certifications, and local market conditions.
Salary by Experience Level
| Experience | Estimated Salary Range |
|---|---|
| 0-2 years (New Graduate) | $37,804 – $40,508 |
| 3-5 years (Mid Career) | $40,508 – $53,882 |
| 5+ years (Experienced) | $53,882 – $74,830 |
| 10+ years (Top Earner) | $74,830 – $99,725 |
Agent salary ranges estimated from BLS percentile data. Individual insurance agent compensation varies by employer, certifications, and specialization.
Insurance Agent Job Market in Warner Robins
The local job market shows a healthy presence of 120 employed insurance agents, contributing to the community’s economy. With a cost-of-living index of 93.789, which is below the national average, agents in Warner Robins benefit from enhanced purchasing power, thus making the insurance agent pay in Warner Robins GA more appealing. Captive agents from single carriers like State Farm or Allstate tend to offer competitive pay, especially when factoring in signing bonuses and training incentives, although they may cap earning potential compared to independent agents or brokers. The disparity in earnings often arises from factors such as the size of a book of business, the differences in commission structures for commercial versus personal lines, and whether agents are affiliated with captive or independent agencies. For agents looking to maximize their income in Warner Robins, cultivating a diverse book of business that includes a focus on commercial lines, furthering professional credentials, and exploring agency ownership could prove vital to enhancing their financial success.
More salary data for Warner Robins, GA:
Frequently Asked Questions
How much do insurance agents make in Warner Robins, GA in 2026?
Is Warner Robins, GA a good place to work as a insurance agent?
Can insurance agents make $100K in Warner Robins?
What is the cost-of-living adjusted insurance agent salary in Warner Robins?
How much does a insurance agent make per hour in Warner Robins?
Related Pages
Compare Salaries
Career Resources
Nearby Cities in Georgia
Written by Jordan Lee, MBA
Career Analyst
Jordan has over 10 years of experience in the insurance industry. He specializes in property and casualty insurance. He has worked in both agency and corporate settings.
Methodology & Data Source
Salary figures on this page are 2026 projections based on the Bureau of Labor Statistics Occupational Employment and Wage Statistics (OEWS) survey, May 2026 release. The BLS reported a median annual salary of $52,010 for insurance agentsin the Warner Robins metropolitan area. A 3.60% compound annual growth rate (CAGR), calculated from 6-year national BLS wage trends, was applied to project current 2026 compensation. Percentile ranges (P10–P90) represent the full salary distribution across experience levels and practice settings in this market.
Data Sources & Methodology
Source: BLS, OEWS, 5-year dataset (–). Per-city data from annual BLS metropolitan area surveys.
2026 figures are projected from 2025 BLS data using a compound annual growth rate (CAGR) of 3.60%, derived from historical BLS wage trends for insurance agents (SOC 41-3021).
Compiled and verified by Jordan Lee, MBA, a licensed insurance agent with 10+ years of clinical experience. · View source data at BLS.gov