Insurance Agent Salary in Virginia: $60,456 (2026)
Quick Answer:Across Virginia's 42 metropolitan areas, the average median insurance agent pay sits at $60,456/year heading into 2026 — a figure projected from 2025 BLS OEWS wage data for SOC 41-3021. Because Virginia sits at BEA RPP 103.2 (3% above the U.S. baseline), that statewide median translates to roughly $58,581 in nationally-comparable purchasing power. Highest-paying metros: Alexandria ($64,709), Richmond ($62,330), Staunton ($60,500).
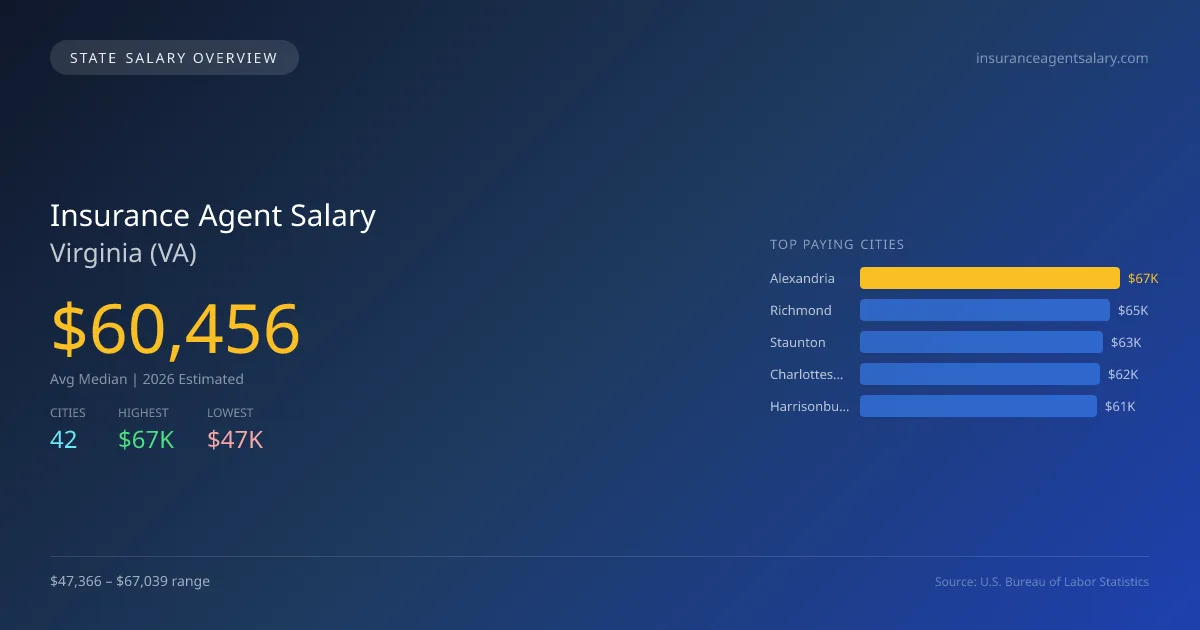
In Virginia, the average median salary for insurance agents is projected to be $60,456 in 2026, which is 6.3% below the national median of $64,522. The highest paying city for this profession is Alexandria, with an expected salary of $67,039, while the lowest is Blacksburg at $47,366. This significant salary gap of $19,673 can be attributed to factors such as cost of living, local market demand, and the concentration of higher-paying jobs in urban areas. Virginia has specific licensing requirements that every aspiring insurance agent must fulfill, including completing pre-licensing education and passing state exams. The state’s demand for insurance professionals is driven by a growing population and a diverse economy that relies heavily on insurance products for businesses and individuals alike. The job market for insurance agents is showing a positive growth outlook, with an estimated annual growth rate of 3.60% from the previous year. Key cities expected to have favorable salaries include Richmond at $64,574, Staunton at $62,678, Charlottesville at $61,777, and Harrisonburg at $61,072. Overall, Virginia presents a stable environment for insurance agents, balancing competitive salaries and opportunities for career advancement.
Virginia Insurance Agent Salary Range
Overall salary range in Virginia: $28,987 (lowest entry-level) to $160,559 (highest top earner)
Virginia vs National Average
Virginia insurance agents earn 6.3% less than the national median ($-4,066/year difference).
Virginia Insurance Agent Salary Distribution (2026)
Insurance Agent salaries in Virginia range from $37,365 (entry-level, 10th percentile) to $129,248 (top earners, 90th percentile), with a median of $60,456. The Virginia median is $4,066 below the US national median of $64,522. The average hourly rate is $29.07/hr. Approximately 5,460 insurance agents are employed across 42 cities.
2019 BLS Actual
$45,489
2025 BLS Actual
$58,355
2026 Current Est.
$60,456
2019–2027 Growth
+37.7%
Salary Trajectory for Insurance Agents in Virginia (2019–2027)
2019–2025: actual BLS OEWS data for this metro area. 2026+: CAGR 3.60% projection.
| Year | Annual Salary | Status |
|---|---|---|
| 2019 | $45,489 | Actual |
| 2020 | $44,823 | Actual |
| 2021 | $52,637 | Actual |
| 2022 | $50,380 | Actual |
| 2023 | $56,443 | Actual |
| 2024 | $58,794 | Actual |
| 2025 | $58,355 | Actual |
| 2026(current) | $60,456 | Estimated |
| 2027 | $62,632 | Projected |
Based on 7 years of BLS OEWS data for the Virginia metropolitan area, the median insurance agent salary grew 28.3% from $45,489 (2019) to $58,355 (2025). At a 3.60% compound annual growth rate, salaries are projected to reach $62,632 by 2027 — a total increase of $17,143 (37.69%) from 2019.
Note: Historical values (2019–2025) are actual BLS OEWS figures for the Virginia metropolitan area, sourced from annual Occupational Employment and Wage Statistics surveys. 2026–2026 figures are current estimates, and 2027 values are projections, calculated using a 3.60% CAGR derived from 7-year BLS historical data. Actual salaries may vary based on employer, experience, certifications, and local market conditions.
Top 5 Highest Paying Cities in Virginia
Lowest Paying Cities in Virginia
| City | Median Salary |
|---|---|
| Blacksburg | $47,366 |
| Radford | $48,194 |
| Bristol | $49,632 |
| Lynchburg | $49,718 |
| Falls Church | $55,797 |
Best Value Cities for Insurance Agents in Virginia
When adjusted for local cost of living, these Virginia cities offer the most purchasing power for insurance agents.
| City | Nominal Salary | CoL Index | Adjusted Salary |
|---|---|---|---|
| Staunton | $62,678 | 91.128 | $68,780 |
| Richmond | $64,574 | 97.858 | $65,987 |
| Alexandria | $67,039 | 103.2 | $64,960 |
| Roanoke | $60,513 | 93.618 | $64,638 |
| Harrisonburg | $61,072 | 94.892 | $64,359 |
Adjusted salary = nominal salary × (100 / CoL index). CoL index: 100 = national average. Lower index = lower cost of living.
Salary by Experience Level in Virginia
| Experience Level | Estimated Annual |
|---|---|
| Entry Level (0-2 years) | $37,365 |
| Mid Career (3-7 years) | $60,456 |
| Experienced (7+ years) | $129,248 |
Estimates based on BLS percentile data averaged across Virginia metro areas. Individual pay varies by employer, certifications, and specialization.
All 42 Cities in Virginia
| # | City | Median Salary |
|---|---|---|
| 1 | Alexandria | $67,039 |
| 2 | Richmond | $64,574 |
| 3 | Staunton | $62,678 |
| 4 | Charlottesville | $61,777 |
| 5 | Harrisonburg | $61,072 |
| 6 | Newport News | $60,983 |
| 7 | Roanoke | $60,513 |
| 8 | Hampton | $60,445 |
| 9 | Centreville | $60,164 |
| 10 | Burke | $59,756 |
| 11 | Suffolk | $59,497 |
| 12 | Norfolk | $59,397 |
| 13 | Tuckahoe | $59,329 |
| 14 | Ashburn | $59,244 |
| 15 | McLean | $59,240 |
| 16 | Reston | $59,176 |
| 17 | Danville | $59,165 |
| 18 | Fredericksburg | $58,911 |
| 19 | Dale City | $58,899 |
| 20 | Manassas | $58,835 |
| 21 | Chesapeake | $58,751 |
| 22 | Salem | $58,672 |
| 23 | Leesburg | $58,587 |
| 24 | Portsmouth | $58,554 |
| 25 | Virginia Beach | $58,524 |
| 26 | Mechanicsville | $58,460 |
| 27 | Springfield | $58,253 |
| 28 | Woodbridge | $58,173 |
| 29 | Sterling | $58,062 |
| 30 | Lake Ridge | $57,986 |
| 31 | Linton Hall | $57,921 |
| 32 | Fairfax | $57,772 |
| 33 | Waynesboro | $57,490 |
| 34 | Annandale | $57,413 |
| 35 | Williamsburg | $57,303 |
| 36 | Winchester | $57,073 |
| 37 | Herndon | $56,684 |
| 38 | Falls Church | $55,797 |
| 39 | Lynchburg | $49,718 |
| 40 | Bristol | $49,632 |
| 41 | Radford | $48,194 |
| 42 | Blacksburg | $47,366 |
More Virginia Salary Data
Senior / Experienced
Top earner salaries for experienced insurance agents.
Explore More Insurance Agent Salary Data
Frequently Asked Questions
How much do insurance agents make in Virginia in 2026?
What is the highest paying city for insurance agents in Virginia?
How does Virginia insurance agent pay compare to the national average?
What is the entry-level insurance agent salary in Virginia?
How many insurance agents are employed in Virginia?
Which Virginia city offers the best value for insurance agents?
Written by Jordan Lee, MBA
Career Analyst
Jordan has over 10 years of experience in the insurance industry. He specializes in property and casualty insurance. He has worked in both agency and corporate settings.
Methodology & Data Source
Statewide salary figures on this page are 2026 projections based on the Bureau of Labor Statistics Occupational Employment and Wage Statistics (OEWS) survey, May 2026 release. A 3.60% compound annual growth rate (CAGR), derived from 6-year national BLS wage trends, was applied to each metro area's reported salary to estimate current 2026 insurance agent compensation across Virginia. State averages are employment-weighted across 42 metro areas — larger metro areas with more insurance agentscontribute proportionally more to the average, producing figures that better reflect typical compensation. Individual pay varies by city, employer, certifications, and experience.
Data Sources & Methodology
Source: BLS, OEWS, 7-year dataset (–). Per-city data from annual BLS metropolitan area surveys.
2026 figures are projected from 2025 BLS data using a compound annual growth rate (CAGR) of 3.60%, derived from historical BLS wage trends for insurance agents (SOC 41-3021).
Compiled and verified by Jordan Lee, MBA, a licensed insurance agent with 10+ years of clinical experience. · View source data at BLS.gov