Insurance Agent Salary in Indiana: $63,830 (2026)
Quick Answer:Across Indiana's 43 metropolitan areas, the average median insurance agent pay sits at $63,830/year heading into 2026 — a figure projected from 2025 BLS OEWS wage data for SOC 41-3021. Because Indiana sits at BEA RPP 91.3 (9% below the U.S. baseline), that statewide median translates to roughly $69,912 in nationally-comparable purchasing power. Highest-paying metros: Indianapolis ($65,710), Carmel ($65,134), Greenwood ($64,346).
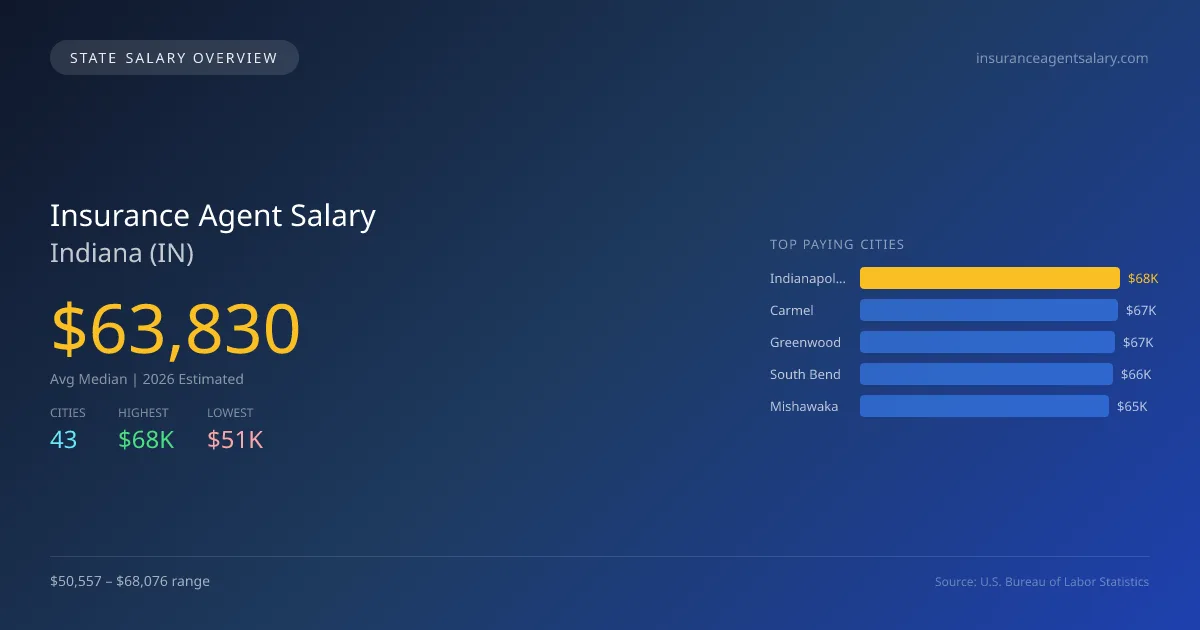
In Indiana, the average median salary for insurance agents in 2026 is projected to be $63,830, which is slightly below the national median of $64,522, resulting in a difference of 1.1%. Indianapolis, the highest-paying city for this role, offers a salary of $68,076, while Evansville, the lowest, has a salary of $50,557. This salary gap of $17,519 can be attributed to factors such as the local cost of living, demand for insurance products, and the concentration of businesses in metropolitan areas. Indiana's state-specific factors include licensing requirements that necessitate completion of pre-licensing education and passing a state exam. The demand for insurance agents is driven by the state's growing population and business sector, contributing to a projected annual growth rate of 3.60%. With a total of 6,960 insurance agents employed across 43 metro areas, the job market remains stable. The cities with the highest projected salaries include Carmel at $67,479, Greenwood at $66,662, South Bend at $66,159, and Mishawaka at $65,309. As the economy continues to develop, opportunities for insurance agents in Indiana are expected to expand further.
Indiana Insurance Agent Salary Range
Overall salary range in Indiana: $34,130 (lowest entry-level) to $207,511 (highest top earner)
Indiana vs National Average
Indiana insurance agents earn 1.07% less than the national median ($-692/year difference).
Indiana Insurance Agent Salary Distribution (2026)
Insurance Agent salaries in Indiana range from $42,295 (entry-level, 10th percentile) to $135,769 (top earners, 90th percentile), with a median of $63,830. The Indiana median is $692 below the US national median of $64,522. The average hourly rate is $30.69/hr. Approximately 6,960 insurance agents are employed across 43 cities.
2019 BLS Actual
$53,938
2025 BLS Actual
$61,612
2026 Current Est.
$63,830
2019–2027 Growth
+22.6%
Salary Trajectory for Insurance Agents in Indiana (2019–2027)
2019–2025: actual BLS OEWS data for this metro area. 2026+: CAGR 3.60% projection.
| Year | Annual Salary | Status |
|---|---|---|
| 2019 | $53,938 | Actual |
| 2020 | $53,954 | Actual |
| 2021 | $59,211 | Actual |
| 2022 | $60,325 | Actual |
| 2023 | $59,378 | Actual |
| 2024 | $61,556 | Actual |
| 2025 | $61,612 | Actual |
| 2026(current) | $63,830 | Estimated |
| 2027 | $66,128 | Projected |
Based on 7 years of BLS OEWS data for the Indiana metropolitan area, the median insurance agent salary grew 14.2% from $53,938 (2019) to $61,612 (2025). At a 3.60% compound annual growth rate, salaries are projected to reach $66,128 by 2027 — a total increase of $12,190 (22.60%) from 2019.
Note: Historical values (2019–2025) are actual BLS OEWS figures for the Indiana metropolitan area, sourced from annual Occupational Employment and Wage Statistics surveys. 2026–2026 figures are current estimates, and 2027 values are projections, calculated using a 3.60% CAGR derived from 7-year BLS historical data. Actual salaries may vary based on employer, experience, certifications, and local market conditions.
Top 5 Highest Paying Cities in Indiana
Lowest Paying Cities in Indiana
| City | Median Salary |
|---|---|
| Evansville | $50,557 |
| Fort Wayne | $50,982 |
| Goshen | $55,113 |
| Munster | $55,783 |
| Elkhart | $55,903 |
Best Value Cities for Insurance Agents in Indiana
When adjusted for local cost of living, these Indiana cities offer the most purchasing power for insurance agents.
| City | Nominal Salary | CoL Index | Adjusted Salary |
|---|---|---|---|
| Carmel | $67,479 | 91.3 | $73,909 |
| Greenwood | $66,662 | 91.3 | $73,014 |
| Mishawaka | $65,309 | 91.3 | $71,532 |
| South Bend | $66,159 | 92.858 | $71,247 |
| Indianapolis | $68,076 | 95.696 | $71,138 |
Adjusted salary = nominal salary × (100 / CoL index). CoL index: 100 = national average. Lower index = lower cost of living.
Salary by Experience Level in Indiana
| Experience Level | Estimated Annual |
|---|---|
| Entry Level (0-2 years) | $42,295 |
| Mid Career (3-7 years) | $63,830 |
| Experienced (7+ years) | $135,769 |
Estimates based on BLS percentile data averaged across Indiana metro areas. Individual pay varies by employer, certifications, and specialization.
All 43 Cities in Indiana
| # | City | Median Salary |
|---|---|---|
| 1 | Indianapolis | $68,076 |
| 2 | Carmel | $67,479 |
| 3 | Greenwood | $66,662 |
| 4 | South Bend | $66,159 |
| 5 | Mishawaka | $65,309 |
| 6 | Lafayette | $64,387 |
| 7 | West Lafayette | $63,380 |
| 8 | Bloomington | $63,279 |
| 9 | Kokomo | $61,642 |
| 10 | Noblesville | $61,300 |
| 11 | Gary | $60,704 |
| 12 | Muncie | $60,627 |
| 13 | Terre Haute | $60,627 |
| 14 | Fishers | $60,484 |
| 15 | Columbus | $60,274 |
| 16 | Michigan City | $60,088 |
| 17 | Plainfield | $59,911 |
| 18 | Valparaiso | $59,803 |
| 19 | Westfield | $59,610 |
| 20 | Franklin | $59,601 |
| 21 | Schererville | $59,468 |
| 22 | Anderson | $59,259 |
| 23 | Richmond | $58,998 |
| 24 | Hammond | $58,971 |
| 25 | Marion | $58,594 |
| 26 | Portage | $58,561 |
| 27 | East Chicago | $58,533 |
| 28 | New Albany | $58,524 |
| 29 | Jeffersonville | $58,411 |
| 30 | Zionsville | $58,246 |
| 31 | Hobart | $58,222 |
| 32 | Merrillville | $58,156 |
| 33 | Granger | $58,137 |
| 34 | Lawrence | $58,001 |
| 35 | Crown Point | $57,761 |
| 36 | Shelbyville | $57,744 |
| 37 | Brownsburg | $57,394 |
| 38 | Avon | $56,987 |
| 39 | Elkhart | $55,903 |
| 40 | Munster | $55,783 |
| 41 | Goshen | $55,113 |
| 42 | Fort Wayne | $50,982 |
| 43 | Evansville | $50,557 |
More Indiana Salary Data
Senior / Experienced
Top earner salaries for experienced insurance agents.
Compare Cities in Indiana
View all comparisons →Explore More Insurance Agent Salary Data
Frequently Asked Questions
How much do insurance agents make in Indiana in 2026?
What is the highest paying city for insurance agents in Indiana?
How does Indiana insurance agent pay compare to the national average?
What is the entry-level insurance agent salary in Indiana?
How many insurance agents are employed in Indiana?
Which Indiana city offers the best value for insurance agents?
Written by Jordan Lee, MBA
Career Analyst
Jordan has over 10 years of experience in the insurance industry. He specializes in property and casualty insurance. He has worked in both agency and corporate settings.
Methodology & Data Source
Statewide salary figures on this page are 2026 projections based on the Bureau of Labor Statistics Occupational Employment and Wage Statistics (OEWS) survey, May 2026 release. A 3.60% compound annual growth rate (CAGR), derived from 6-year national BLS wage trends, was applied to each metro area's reported salary to estimate current 2026 insurance agent compensation across Indiana. State averages are employment-weighted across 43 metro areas — larger metro areas with more insurance agentscontribute proportionally more to the average, producing figures that better reflect typical compensation. Individual pay varies by city, employer, certifications, and experience.
Data Sources & Methodology
Source: BLS, OEWS, 7-year dataset (–). Per-city data from annual BLS metropolitan area surveys.
2026 figures are projected from 2025 BLS data using a compound annual growth rate (CAGR) of 3.60%, derived from historical BLS wage trends for insurance agents (SOC 41-3021).
Compiled and verified by Jordan Lee, MBA, a licensed insurance agent with 10+ years of clinical experience. · View source data at BLS.gov