Insurance Agent Salary in Hartford, CT: $79,378 (2026)
Quick Answer:A full-time insurance agent in Hartford, CT earns a median $79,378/year (≈ $38.17/hour) in nominal terms for 2026 — projected from BLS OEWS 2025 (SOC 41-3021). Once you factor in Hartford's price level (3% above national, BEA RPP 102.7), that paycheck buys what $77,257 would nationally. Nominal pay sits 0.7% above the Connecticut state average.
Official BLS data · View source
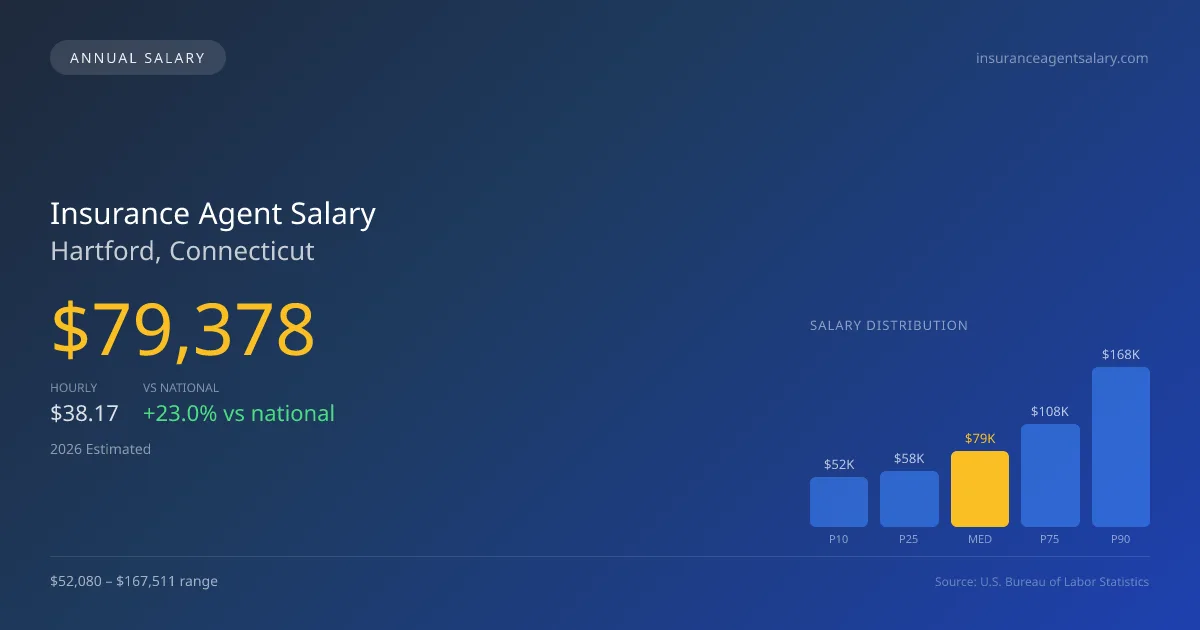
In Hartford, Connecticut, the insurance agent salary in Hartford reflects a robust job market with a median annual pay of $79,378 as projected for 2026. This figure is noteworthy, surpassing the national median of $64,522 by over 23%. The salary range for insurance agents in this area extends from $52,080 at the 10th percentile to $167,511 at the 90th percentile, showcasing significant income disparities driven by different agency models. According to data derived from 2025 BLS OEWS surveys, captive agents typically earn more due to structured commissions, while independent agents may see fluctuating incomes based on their book of business. The balance between these employment types plays a significant role in shaping Hartford's insurance pay dynamics.
Salary Breakdown
| Percentile | Annual | Hourly |
|---|---|---|
| Entry Level (P10) | $52,080 | $25.04 |
| Lower Range (P25) | $58,171 | $27.97 |
| Median (P50)(typical) | $79,378 | $38.17 |
| Upper Range (P75) | $107,547 | $51.71 |
| Top Earners (P90) | $167,511 | $80.53 |
Median Salary Position
23.02% above the national average
2026 Salary Percentile Distribution in Hartford
In Hartford, CT, the insurance agent salary spread from the 10th to 90th percentile is $115,431 (2026 est.). At $79,378, the local median is 23.02% above the national median of $64,522.
Salary Calculator
At 40 hours/week in Hartford: You'd be in the entry-level range
How Hartford Insurance Agent Pay Compares
Hartford median: $79,378/year (2026)
| Compared To | Median Salary | Hartford Pays |
|---|---|---|
| Connecticut Average | $78,827 | +0.70% more |
| National Average | $64,522 | +23.02% more |
Insurance Agents in Hartford, CT earn a median of $79,378 per year (2026 est.), which is 23.02% higher than the national median of $64,522 and 0.70% above the Connecticut state average of $78,827.
Cost-of-Living Adjusted Salary
Hartford has a cost of living 2.75% above the national average.
Adjusted salary = nominal × (100 / CoL index). CoL index: 100 = national average.
Hartford, CT has a cost-of-living index of 102.746 (above the national average of 100). While the nominal salary of $79,378 is competitive, the higher cost of living reduces purchasing power to an effective $77,257 — a 2.67% reduction.
Compare Purchasing Power
Select a city to see how your salary compares after cost of living
Select a city above to compare purchasing power
2019 BLS Actual
$61,500
2025 BLS Actual
$76,620
2026 Current Est.
$79,378
2019–2027 Growth
+33.7%
Salary Trajectory for Insurance Agents in Hartford (2019–2027)
2019–2025: actual BLS OEWS data for this metro area. 2026+: CAGR 3.60% projection.
| Year | Annual Salary | Status |
|---|---|---|
| 2019 | $61,500 | Actual |
| 2020 | $65,490 | Actual |
| 2021 | $62,110 | Actual |
| 2022 | $78,350 | Actual |
| 2023 | $75,480 | Actual |
| 2024 | $79,860 | Actual |
| 2025 | $76,620 | Actual |
| 2026(current) | $79,378 | Estimated |
| 2027 | $82,236 | Projected |
Based on 7 years of BLS OEWS data for the Hartford metropolitan area, the median insurance agent salary grew 24.6% from $61,500 (2019) to $76,620 (2025). At a 3.60% compound annual growth rate, salaries are projected to reach $82,236 by 2027 — a total increase of $20,736 (33.72%) from 2019.
Note: Historical values (2019–2025) are actual BLS OEWS figures for the Hartford metropolitan area, sourced from annual Occupational Employment and Wage Statistics surveys. 2026–2026 figures are current estimates, and 2027 values are projections, calculated using a 3.60% CAGR derived from 7-year BLS historical data. Actual salaries may vary based on employer, experience, certifications, and local market conditions.
Salary by Experience Level
| Experience | Estimated Salary Range |
|---|---|
| 0-2 years (New Graduate) | $52,080 – $58,171 |
| 3-5 years (Mid Career) | $58,171 – $79,378 |
| 5+ years (Experienced) | $79,378 – $107,547 |
| 10+ years (Top Earner) | $107,547 – $167,511 |
Agent salary ranges estimated from BLS percentile data. Individual insurance agent compensation varies by employer, certifications, and specialization.
Insurance Agent Job Market in Hartford
With approximately 2,300 insurance agents employed in the Hartford region, the job market remains competitive, albeit challenged by a cost-of-living index of 102.746. This index indicates that while salaries are higher than the national average, purchasing power is somewhat limited compared to other regions. Captive agencies like State Farm and Allstate continue to dominate the landscape, but independent agencies and larger commercial brokerages, including firms like Aon and Marsh, are gaining traction due to their broader product offerings and potential for higher commissions. The noticeable salary spread here arises from factors like renewal commissions, agency ownership equity, and the differences between commercial and personal lines, with the former generally commanding significantly higher pay. For agents aiming to maximize their pay in Hartford, focusing on building a strong book of business and considering niche markets within commercial lines could be advantageous strategies.
More salary data for Hartford, CT:
Frequently Asked Questions
How much do insurance agents make in Hartford, CT in 2026?
Is Hartford, CT a good place to work as a insurance agent?
Can insurance agents make $100K in Hartford?
What is the cost-of-living adjusted insurance agent salary in Hartford?
How much does a insurance agent make per hour in Hartford?
Related Pages
Compare Salaries
Career Resources
Nearby Cities in Connecticut
Written by Jordan Lee, MBA
Career Analyst
Jordan has over 10 years of experience in the insurance industry. He specializes in property and casualty insurance. He has worked in both agency and corporate settings.
Methodology & Data Source
Salary figures on this page are 2026 projections based on the Bureau of Labor Statistics Occupational Employment and Wage Statistics (OEWS) survey, May 2026 release. The BLS reported a median annual salary of $76,620 for insurance agentsin the Hartford metropolitan area. A 3.60% compound annual growth rate (CAGR), calculated from 6-year national BLS wage trends, was applied to project current 2026 compensation. Percentile ranges (P10–P90) represent the full salary distribution across experience levels and practice settings in this market.
Data Sources & Methodology
Source: BLS, OEWS, 7-year dataset (–). Per-city data from annual BLS metropolitan area surveys.
2026 figures are projected from 2025 BLS data using a compound annual growth rate (CAGR) of 3.60%, derived from historical BLS wage trends for insurance agents (SOC 41-3021).
Compiled and verified by Jordan Lee, MBA, a licensed insurance agent with 10+ years of clinical experience. · View source data at BLS.gov